Business Context
Understanding the real-world value and application
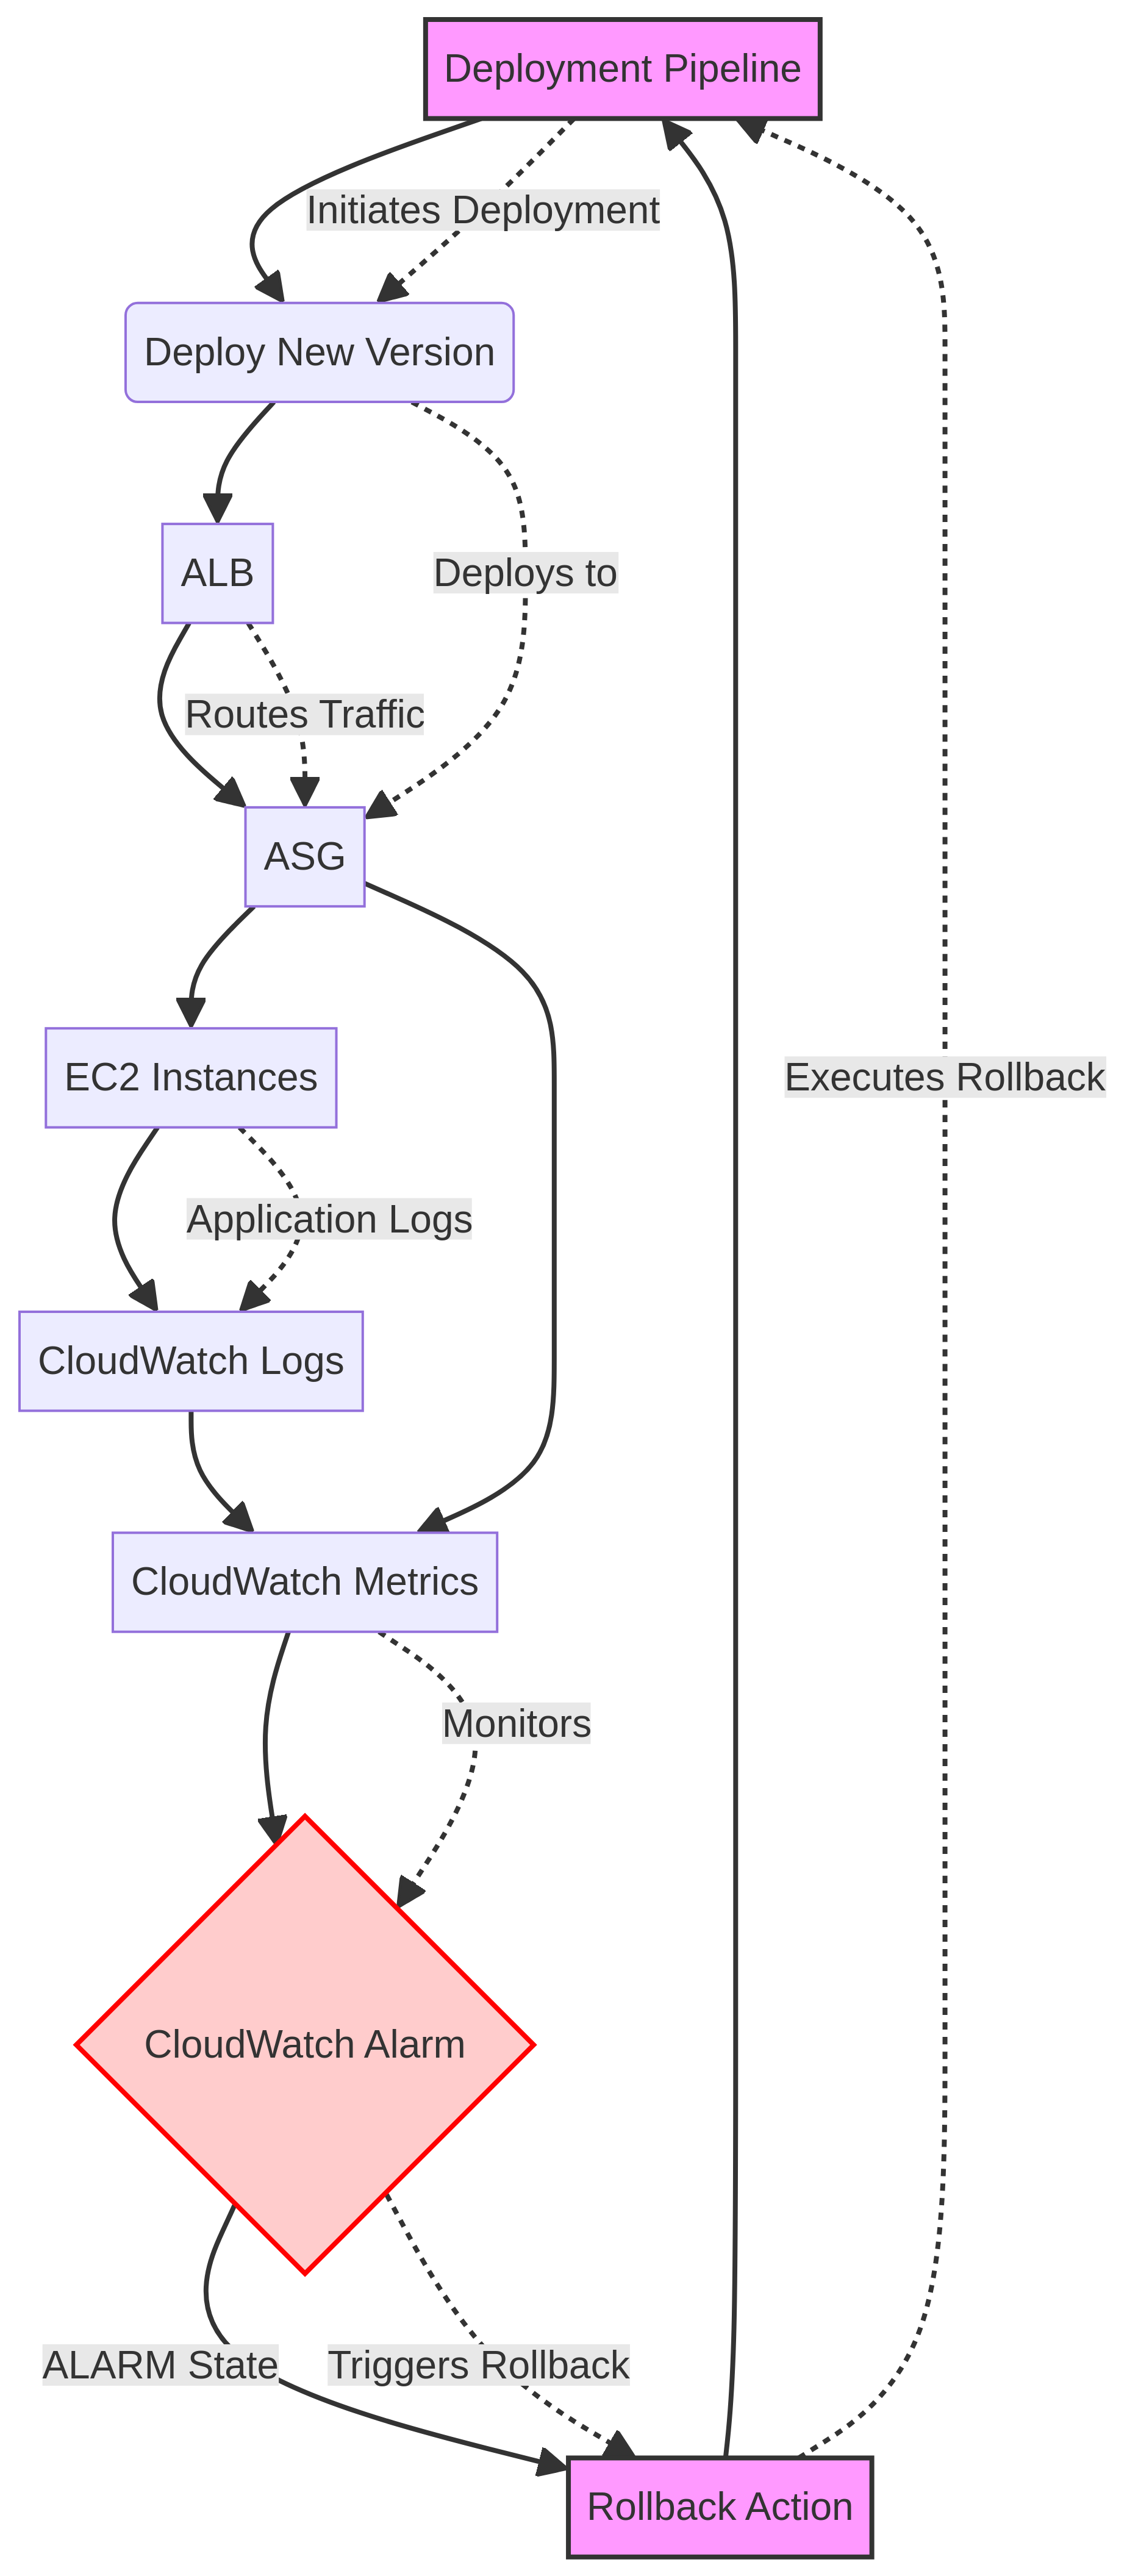
The Problem
- Lack of real-time visibility into Kubernetes (EKS) cluster health and application performance, leading to delayed incident detection and resolution.
- Difficulty in correlating metrics, logs, and traces across distributed microservices running on EKS, hindering efficient root cause analysis.
- Inefficient resource utilization and potential cost overruns due to insufficient monitoring data for capacity planning and scaling decisions within the EKS environment.
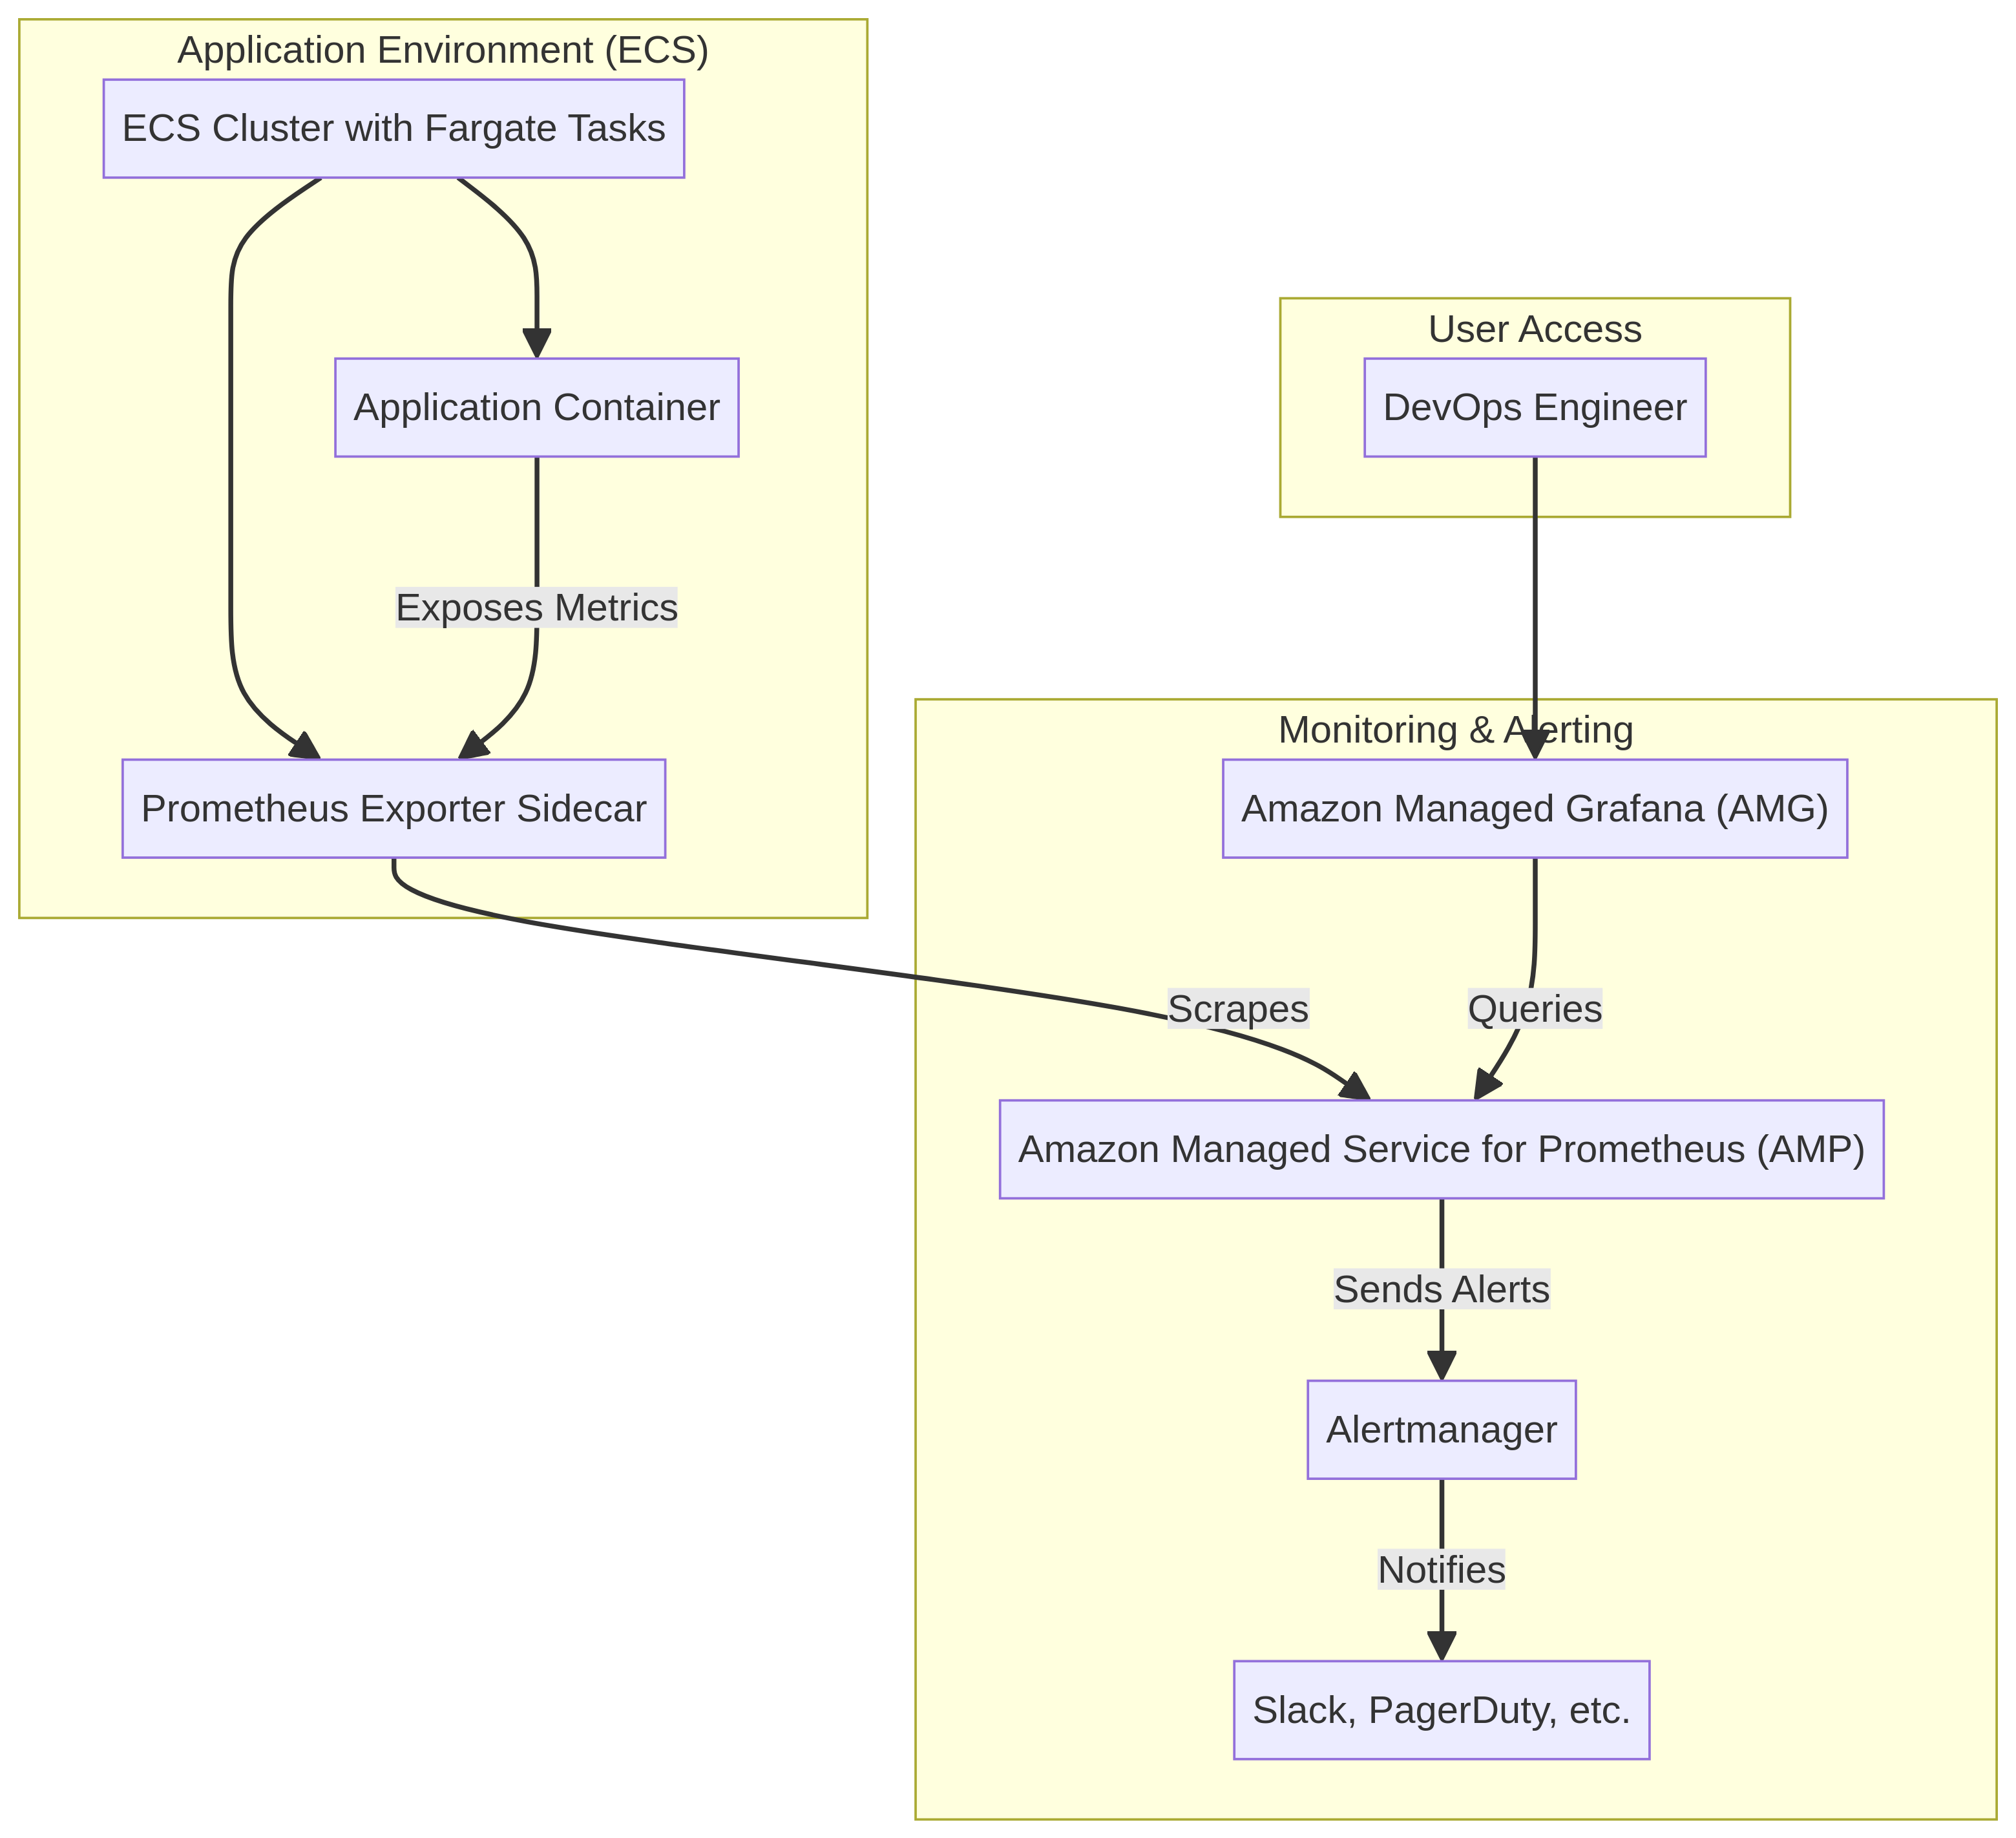
The Solution
- Deploys Prometheus for robust, time-series metric collection from EKS clusters, nodes, and application pods, ensuring comprehensive data capture.
- Integrates Grafana to provide rich, customizable dashboards and alerts, visualizing Prometheus metrics and enabling proactive operational insights.
- Leverages AWS Container Insights to collect, aggregate, and summarize metrics and logs from containerized applications and microservices on EKS, enhancing observability.
Business Value
- Reduces mean time to detection (MTTD) for critical incidents by 40%, improving system reliability and customer satisfaction.
- Optimizes AWS EKS resource utilization by 15-20% through data-driven scaling and capacity planning, leading to significant cost savings.
- Increases developer productivity by 25% by providing self-service observability tools and faster debugging capabilities.
- Achieves 99.99% uptime SLA for critical applications by enabling proactive monitoring and rapid response to performance degradation.
Risk Mitigation
- Mitigates the risk of undetected system failures and outages by providing continuous, real-time monitoring of all EKS components.
- Addresses the risk of performance bottlenecks and degraded user experience through proactive alerting and trend analysis from Grafana.
- Reduces the risk of security vulnerabilities going unnoticed by monitoring network traffic and system logs for anomalous behavior within the Kubernetes cluster.
- Minimizes the risk of compliance violations related to data retention and audit trails by centralizing logs and metrics for forensic analysis.